Using NLP and Deep Learning to Predict Stock Price Movememnts

In the financial services and banking industry, armies of analysts are dedicated to pouring over, analyzing, and attempting to quantify qualitative data from news and SEC mandated reporting. The vast amount of textual and quantitative information involved in analyzing a company means that an analyst is dedicated to covering only a few companies, and the process of digging through dry reports is hardly the sexiest job on Wall Street.
Nonetheless, equity research departments are vital components of the financial services industry, despite the criticisms they face for conflicts of interest between a banks’ need for profit, internal team politics, and a fiduciary duty to serve clients. Stumbling through the web I ran into several academic papers and projects that explore natural language processing and machine learning techniques to explore solutions to this problem, but most relied on relatively elementary methods. As an enthusiast of topics like markets, prices, and machine learning, I saw an opportunity for a new data science project. My hypothesis is that by reducing the human biases in the analysis of these findings, more useful signals could be uncovered and traded upon.
In this project I use SEC 8-K filings to predict whether a stock will go up, down, or stay, after disclosing a new event. I experiment with several neural network architectures including a fully-connected multilayer perceptron network, convolutional neural net, recurrent neural net using gated recurrent units, and a hybrid model in which a convolutional layer feeds into a recurrent layer. In this post I won’t go into how these architectures work or why they work well with text data, but quick backgrounds on on them are available here and here.
What is an SEC 8-K?
The SEC (Securities and Exchange Commission) is a department of the American government responsible for regulating American financial markets (i.e. stock and bond markets). Companies that are publicly traded on exchanges like the New York Stock Exchange or Nasdaq must regularly file reports to inform the public on information such as past earnings, growth goals, and potential risks to their business. The 8-K is a report mandated by the SEC that companies must use to inform their shareholders of changes in their business. Possible reasons for filing an 8-K could be a change in the company’s leadership, a new acquisition, or bankruptcy. 8-K documents are valuable to analysts and investors as a way to obtain information directly from the source as soon as an event is disclosed. Below is an excerpt from an 8-K filed by Facebook in 2014 when announcing its purchase of WhatsApp:
On February 19, 2014, Facebook, Inc. (“Parent”) entered into an Agreement and Plan of Merger and Reorganization (the “Merger Agreement”) with Rhodium Acquisition Sub II, Inc., a Delaware corporation and wholly owned (in part directly and in part indirectly) subsidiary of Parent (“Acquirer”), Rhodium Merger Sub, Inc., a Delaware corporation, a direct wholly owned subsidiary of Acquirer (“Merger Sub”), WhatsApp Inc., a Delaware corporation (“WhatsApp”), and Fortis Advisors LLC, as the stockholders’ agent.Thousands of similar documents were scraped in the hopes of extracting meaningful information from them through NLP.
Data Collection & Feature Engineering
8-K documents were scraped from the SEC Edgar database for all companies in the S&P 500 as of May 2018, using the BeautifulSoup python package. From each text, I extracted metadata such as the date and time a document was published and the categories of disclosures made, while tables and charts were discarded. Because of the size of the data and time needed to scrape and collect it, I setup a high-memory Google Cloud instance and Google Cloud storage bucket. Historical open and adjusted close price data for the same companies was gathered from the AlphaVantage API. Historical index prices for the VIX and GSPC (S&P 500) was downloaded from Yahoo Finance.
After removing a handful of unusable texts, I ended up with a total of 17,000 documents, spanning between the years 2011 and 2018 for all 500 companies in the S&P 500.
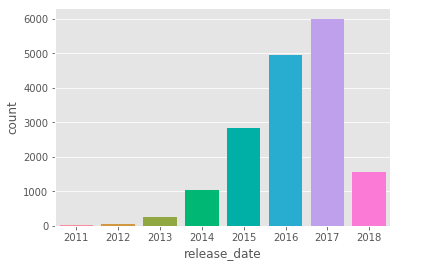
Count of documents released each year
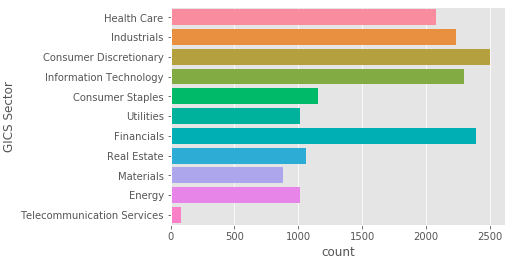
Count of documents by company’s industry
For each document release, one year, one quarter, and one month historical moving average price movements were calculated using 20, 10, and 5 day windows based on the time right before a document’s release, and normalized by the change in the S&P 500 index. All windows refer to days that the NYSE and Nasdaq were actually open (non-holiday weekdays). The target feature was calculated as the change in price of a stock right before and after a document’s release, normalized by the change in the S&P 500. For example, for a company that released a document on February 5, 2018, the change in its opening and adjusted close price was calculated, minus the change during the same time for the S&P 500 index. The normalized changes were labeled as either “up” (> 1%), “down” (< -1% ), or “stay“(between -1 and 1%).
List of features including historical stock movements, text metadata, documents, and trade signals
Text Preprocessing
I preprocessed all texts by removing stopwords, punctuation, and numbers, lemmatizing words and converting them to lower case. This was accomplished using the NLTK WordNet corpus reader in combination with Dask for a multithreading speedboost. All documents were padded with zeros to a uniform length of 34603 words. This cutoff was chosen at the 90th percentile of document lengths in order to preserve most textual information but prevent the dataset from becoming unnecessarily large from the few largest texts.

Photo by Melinda Gimpel on Unsplash
Although the text could have been processed in a variety of ways from simple unigram models to training my own word embeddings, I decided save time and resources and take advantage of pretrained embeddings. I chose the Stanford NLP GloVe Wikipedia 2014 + Gigaword 5 100 dimension embedding set since it was trained on Wikipedia and would likely have vectors for many of the industry-specific words found in the reports. An in-depth explanation of word embeddings is beyond the scope of this post, but a good explanation is available here.
Machine Learning
Before any machine learning could happen, I did some standard data transformations such as one hot encoding categorial features like company industry and disclosure category, and standardizing continuous features to have a mean of 0 and standard deviation of 1.
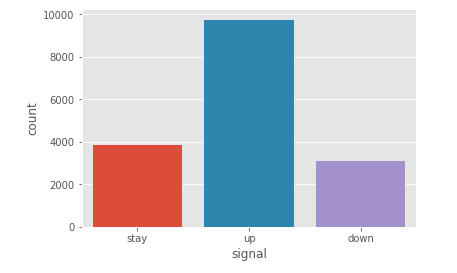
This project presented a classic case of class imbalances, with “up” signals represented twice as often as “stay” or “down”
The dataset was then randomly shuffled and split into 80% train and 20% test data. I had noticed earlier that the dataset suffered from imbalanced classes, with over 50% of samples labled as (“up”), which intuitively makes sense considering the steady rise of the S&P 500 over the last decade. I corrected for this using oversampling on the training data, with randomly selected samples in each class duplicated to have an equal number of samples of each of the three classes.
Four different machine learning architectures were constructed using Keras with a Tensorflow backend, consisting of two input layers (one for text documents, one for the remaining features), an embedding layer with the pretrained GloVe vectors, and:
(a) a multilayer perceptron fully connected network — “MLP”,
(b) two 1D convolutional layers — “CNN”,
(c) a bidirectional GRU layer — “RNN”, and
(d) a 1D convolutional layer, followed by a GRU layer — “CNN-RNN”.
Each network was trained for 10 epochs, with a batch size of 32, on two NVIDIA K80 GPUs.
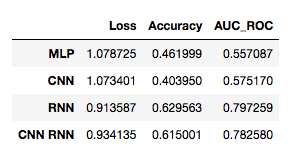
Although the RNN model yielded the highest overall accuracy and AUC ROC scores, it took twice as long to train as the CNN RNN hybrid model.The RNN and CNN-RNN networks achieved the highest accuracy and auc_roc scores on the validation dataset. However the CNN-RNN model required half of the training time of the RNN model. I continued training the CNN-RNN model for another 15 epochs, which unfortunately only yielded a minimal gain in validation loss.
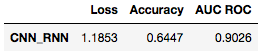
Results of highest-performing CNN-RNN model, after 23 epochs of training
The final CNN-RNN model yielded an accuracy of 64.5% on the validation data, This is a 94% improvement over a baseline random choice model, as well as a 16% improvement over the Stanford and Google paper this project was modeled from. These results suggests that although word-embeddings and neural networks require more time and computational resources to build and train, the gains in accuracy are worth the effort.
Final Thoughts
This project only touches the surface of how the latest natural language processing techniques and deep learning models could be used to extract meaningful information from SEC reporting and asses swings in a company’s stock price. A more specialized set of word embeddings, or advanced techniques such as Sense2Vec could be explored in order to gather more nuanced information from text. Other sources of text could be included as well, such as geopolitical and macroeconomic news that influences financial markets.
Additionally, although CNN, RNN, and hybrid architectures are currently considered some of the most effective state-of-the-art NLP models, there are still a virtually unlimited number of combinations to explore within those models, in regards to RNN vs LSTM vs GRU units, and the depth, size, and hyper parameters regarding RNN and CNN layers, and the use of pooling layers. Unfortunately time and money restrictions (Using multiple GPUs and processing large datasets can quickly add up in Google Cloud) did not allow me to explore these possibilities. Nonetheless, a 64% accuracy suggests that these efforts could be worth the while to quickly extract data from large quantities of textual data and make trading decisions, tasks that would normally require armies of specially-trained analysts.